
Page 228 - 2021 강원성인지통계
P. 228
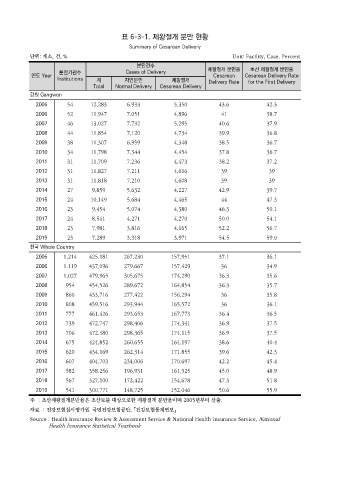
표 6-3-1. 제왕절개 분만 현황

                                              Summary of Cesarean Delivery
            단위: 개소, 건, %                                                           Unit: Facility, Case, Percent
                                                 분만건수
                      분만기관수                  Cases of Delivery            제왕절개 분만율       초산 제왕절개 분만율
            연도 Year                                                         Cesarean   Cesarean Delivery Rate
                     Institutions  계         자연분만            제왕절개         Delivery Rate  for the First Delivery
                                  Total  Normal Delivery  Cesarean Delivery
            강원 Gangwon
              2005       54      12,283       6,933           5,350           43.6             42.3
              2006       52      11,947       7,051           4,896            41              38.7
              2007       46      13,027       7,732           5,295           40.6             37.9
              2008       44      11,854       7,120           4,734           39.9             36.8

              2009       38      11,307       6,959           4,348           38.5             36.7
              2010       34      11,798       7,344           4,454           37.8             36.7
              2011       31      11,709       7,236           4,473           38.2             37.2
              2012       31      11,827       7,211           4,616            39              39
              2013       31      11,818       7,210           4,608            39              39
              2014       27      9,859        5,632           4,227           42.9             39.7
              2015       24      10,149       5,684           4,465            44              47.3
              2016       23      9,454        5,074           4,380           46.3             50.1
              2017       24      8,541        4,271           4,270           50.0             54.1
              2018       23      7,981        3,816           4,165           52.2             56.7

              2019       23      7,289        3,318           3,971           54.5             59.0
            전국 Whole Country
              2005     1,214    425,181      267,230         157,951          37.1             36.1
              2006     1,119    437,096      279,667         157,429           36              34.9
              2007     1,027    479,965      305,675         174,290          36.3             35.6
              2008      954     454,526      289,672         164,854          36.3             35.7
              2009      860     433,716      277,422         156,294           36              35.8
              2010      808     459,516      293,944         165,572           36              36.1
              2011      777     461,426      293,653         167,773          36.4             36.5
              2012      739     472,747      298,406         174,341          36.9             37.5
              2013      706     472,480      298,365         174,115          36.9             37.5
              2014      675     424,852      260,655         164,197          38.6             40.4
              2015      620     434,169      262,314         171,855          39.6             42.3

              2016      607     404,703      234,006         170,697          42.2             45.4
              2017      582     358,256      196,931         161,325          45.0             48.9
              2018      567     327,100      172,422         154,678          47.3             51.8
              2019      541     300,771      148,725         152,046          50.6             55.9
            주  : 초산제왕절개분만율은 초산모를 대상으로한 제왕절개 분만율이며 2005년부터 산출.
            자료  : 건강보험심사평가원․국민건강보험공단, 「건강보험통계연보」
            Source : Health Insurance Review & Assessment Service & National Health Insurance Service, National
                        Health Insurance Statistical Yearbook